Life Style
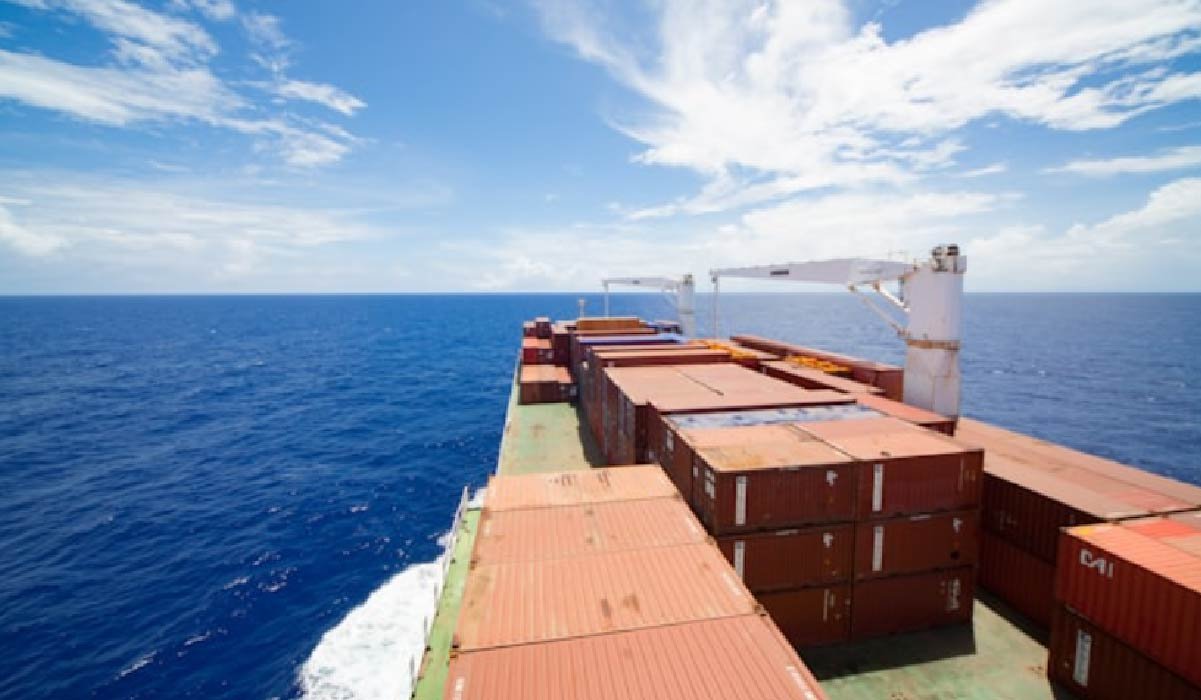
Cost Comparison: Air vs. Sea Freight to Australia
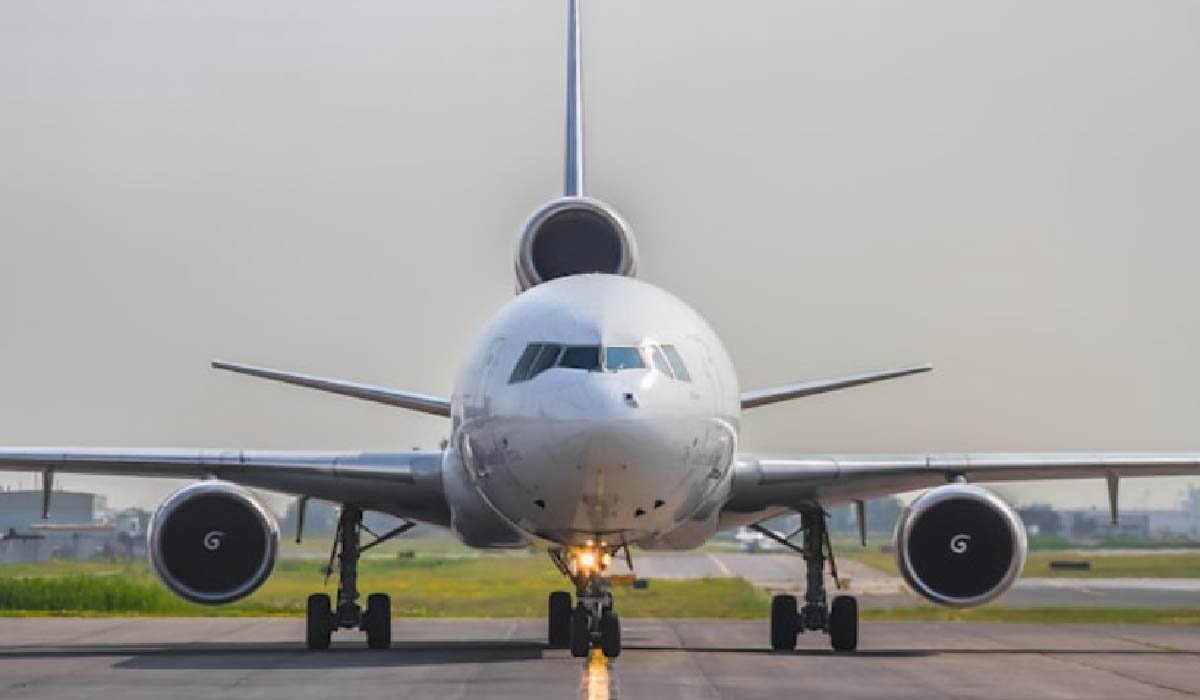
I have watched too many operations teams pick a mode on a single number, cost per kilogram or the headline rate on a 40-foot container, then scramble when destination fees, payment friction, and working-capital drag erase the savings. The decision turns on cost per day of speed, not sticker price alone. If air costs an extra US$1,600 but saves sixteen days and earlier delivery adds US$140 per day in gross margin, air wins by a wide margin. This guide gives you a numbers-first framework that folds in Australian border fees, GST and duty rules, payment and foreign-exchange costs, insurance, transit-time variability, and emissions so you can compare air and ocean on total landed cost and choose the mode that preserves more margin.
You will get a simple breakeven method, current rate ranges for air and ocean into Australia, the mandatory Australian fees that shift totals, and plain-English payment guidance so transfer and FX costs do not quietly erase freight savings. You will also see worked examples and a reusable worksheet structure. The audience is global small and medium enterprises, e-commerce brands, and operations or finance leads shipping to Australia from Asia-Pacific, North America, or Europe.
Introduction: A Numbers-First Way to Pick Air or Sea to Australia
Use cost per day of speed as your decision lens and compare it to margin gained by arriving earlier to avoid mode mistakes.
The framework is direct. Compute your air total, freight plus surcharges plus Australian fees plus insurance plus payment and FX costs. Compute your sea total using the same line items. Estimate transit and door-delivery days for both modes on your lane. Divide the cost difference by the days saved to get cost per day of speed. If that number is below the margin per day you gain from earlier delivery, choose air. If it is above, choose sea. This guide includes realistic 2025 ranges for air and ocean, the Australian import fees and GST or duty rules that can swing outcomes, and a clear explanation of how wire fees, intermediary charges, and FX markups add 1 to 3 percent or more to landed cost if you do not shop payment rails.
What You Will Get From This Guide
Learn a breakeven method to decide air versus sea using time saved and incremental cost. Use current, realistic ranges for air and ocean into Australia that you can plug into a quick worksheet. See the Australian import fees and GST or duty rules that materially move total landed cost, including the Import Processing Charge bands and the DAFF Biosecurity Full Import Declaration cost-recovery charges by mode. Get cross-border payment mechanics explained so you understand transfer fees, intermediary deductions, and FX spreads, and why paying carriers and brokers in Australian dollars often cuts friction and cost.
Why Payments Belong in the Freight Decision
Bank wire fees, intermediary charges, and FX markups can add 1 to 3 percent or more to landed cost, which can flip the mode decision on a margin-sensitive shipment. Payment timing and currency choice, for example paying carriers and brokers in AUD rather than converting at the last minute from USD or EUR, affect fees and supplier behavior. Clear payment rails reduce delays, disputes, and the hours finance spends tracing missing or deducted funds. SWIFT estimates that more than US$1.6 billion is spent annually investigating delayed cross-border payments, and richer ISO 20022 data is starting to reduce that friction. Add a payments line to your landed-cost model so you can compare rails and surface hidden costs before you book.
BLUF: When Air Wins, When Sea Wins
Calculate cost per day of speed and compare it to your gross margin per day gained from earlier delivery, then pick the mode that preserves more margin.
Start by adding your air total, freight plus surcharges plus Australian fees, Import Processing Charge and DAFF Biosecurity FID charge, plus insurance plus payments and FX. Do the same for sea, freight plus destination charges plus the same Australian fees, insurance, and payments line. Estimate door-to-door transit and delivery days for both modes on your lane. Then run the breakeven calculation, subtract the sea total from the air total and divide by the days saved. The result is your cost per day of speed. Compare that number to the gross margin per day you gain from earlier delivery. If arriving sixteen days earlier avoids stockouts worth US$140 per day in margin, and air costs US$100 per day, choose air. If the margin gain is only US$60 per day, choose sea and bank the savings.
Breakeven Method You Can Run in Minutes
Compute your air total by adding freight, surcharges, Australian fees including the Import Processing Charge based on customs value and DAFF Biosecurity FID at A$46 for air, insurance, and a payments or FX line that captures transfer fees and spread versus mid-market. Compute your sea total the same way, using the ocean freight rate, destination charges such as terminal handling and wharfage, Import Processing Charge in the same band, DAFF Biosecurity FID at A$68 for sea, insurance, and the same payments line. Estimate door-to-door days for both modes on your lane so you capture deconsolidation and last mile. The breakeven formula is air total minus sea total divided by sea days minus air days. Compare that to your gross margin per day gained from earlier delivery. Choose the mode that preserves more margin.
Quick Numeric Example
If air is US$1,600 more than sea and saves sixteen days, your cost per day of speed is US$1,600 divided by sixteen, or US$100. If earlier delivery adds US$140 per day in margin, air wins because you net US$40 per day. If your margin gain is US$60 per day, sea wins because you preserve US$40 per day by choosing the slower mode.
Add Emissions as a Tiebreaker
Air emits 1.13 kilograms of CO2 equivalent per tonne-kilometer, while sea emits 0.023 kilograms CO2 equivalent per tonne-kilometer, a 50x difference. If your gross margin per day is similar for both modes, choose sea to hit environmental targets and lower your carbon footprint in external reporting.
Step 1: Scope Your Shipment and Define Terms
Collect commodity, HS code, customs value, dimensions, weight, and delivery details before you request quotes so forwarders can price accurately the first time.
You need the commodity description and the Harmonized System code at six to ten digits where available, because the HS code drives eligibility for duty relief, for example under the Australia-United States Free Trade Agreement about 99 percent of tariff lines are duty-free, and determines the Department of Agriculture, Fisheries and Forestry biosecurity risk profile. Declared customs value determines the GST assessment and the Import Processing Charge band. Unit dimensions and weight per handling unit, stackability, and packaging type define chargeable weight for air and cubic meters for less-than-container-load ocean. Note your origin, handover point, and destination delivery details such as dock access, tail-lift requirements, and appointment needs. State your required arrival window and any temperature or dangerous-goods constraints up front.
Collect These Inputs Before Quoting
Provide commodity description and HS code at six to ten digits where you have it. State the customs value, the currency, and the Incoterms basis you intend to use. List unit dimensions and weight per handling unit, carton or pallet, plus stackability and packaging type. Note origin, handover point, and destination delivery details including dock access, tail-lift, and appointment needs. Specify your required arrival window and any temperature or dangerous-goods constraints.
Plain-Language Definitions You Will Use
Chargeable weight for air is the higher of actual weight and volumetric weight. Volumetric weight uses a divisor, typically 6,000 cubic centimeters per kilogram under IATA rules. Cubic meter, or CBM, is length times width times height in meters and is the rating unit for less-than-container-load; consolidators price per CBM with minimum charges. Full container load, FCL, gives you a dedicated container. Less-than-container-load, LCL, shares space with other shippers and adds deconsolidation steps at destination. Incoterms matter, DAP means the seller delivers to a named place and the buyer handles import clearance, DDP means the seller handles import and pays duties and GST, DPU means the seller delivers unloaded at a named place.
Step 2: Calculate Air Chargeable Weight Correctly
Most airlines apply IATA’s 6,000 cubic centimeters per kilogram volumetric divisor, so chargeable weight is the maximum of actual weight and volumetric weight.
Volumetric weight in kilograms equals length times width times height in centimeters divided by 6,000. A quick shortcut is to multiply your cubic meters by 167 to get volumetric kilograms. Chargeable weight is whichever is higher, actual kilograms or volumetric kilograms. Some couriers use different divisors, so confirm the volumetric factor in your quote.
Formula and Quick Conversions
Volumetric weight in kilograms equals length times width times height in centimeters divided by 6,000. The shortcut is CBM times 167 equals volumetric kilograms. Chargeable weight equals the higher of actual kilograms and volumetric kilograms.
Worked Micro-Examples
Suppose you have 0.3 cubic meters at 45 kilograms actual weight. Volumetric is 0.3 times 167, which is roughly 50 kilograms. Chargeable weight is 50 kilograms because volumetric is higher. If you have 1.2 cubic meters at 150 kilograms actual, volumetric is 1.2 times 167, roughly 200 kilograms. Chargeable weight is 200 kilograms. Confirm the divisor in your quote because some express products use a different factor.
Step 3: Price the Base Freight Using Air and Ocean Benchmarks
Indicative 2025 China to Australia ranges are air US$4.50 to US$8.00 per kilogram, less-than-container-load US$80 to US$150 per cubic meter, and a 40-foot full container load US$2,200 to US$4,200.
Global air cargo spot averages US$2.45 per kilogram signal broader market conditions, but lane-specific quotes prevail because capacity, service level, fuel surcharges, and war-risk premiums shift final pricing. The World Container Index in mid-June 2025 sat at about US$3,543 per 40-foot container, which underscores volatility. Build buffers into your planning rates. Seasonality, equipment availability, service level, and carrier-specific surcharges all move the final number you pay.
Air Freight Planning Ranges
For shipments ex-East Asia to Australia, plan US$4.50 to US$8.00 per kilogram depending on service speed, capacity, and the week you book. Use your chargeable weight from step two, multiply by the quoted rate, and add any carrier surcharges listed separately.
Ocean Freight Planning Ranges
LCL typically runs US$80 to US$150 per cubic meter plus origin and destination fees. A 40-foot full container load runs US$2,200 to US$4,200, with port pair, peak seasons, and equipment availability driving variance. Many lanes price a 40-foot container more efficiently than two 20-foot boxes once you include destination charges, so compare both options if your cargo volume is on the cusp.
Transit-Time Benchmarks You Can Use
Singapore to Australia on standard air freight typically takes eight to ten days end to end. Ocean runs thirty to forty days door to door depending on the port pair. Express air courier can achieve one to four days for small consignments at a premium rate.
For readers moving cargo from Southeast Asia into Australia, especially those shipping out of Singapore, it helps to pair lane-level transit expectations with a concrete paperwork walkthrough so nothing stalls at origin or arrival. After you have scoped mode and Incoterms, a step-by-step country guide to singapore to australia shipping lays out documents, timelines, and customs tips you can compare against your forwarder plan, so your booking, clearance, and delivery sequence stays predictable even during peak periods.
Step 4: Add Australian Importer-Side Fees and Destination Charges
Budget the Import Processing Charge by consignment value band, the DAFF Biosecurity Full Import Declaration charge by mode, and carrier or terminal destination charges that can swing totals.
The Australian Border Force Import Processing Charge for electronic lodgement is A$0 for consignments at or below A$1,000 in value, A$50 for consignments above A$1,000 but below A$10,000, and A$152 for consignments at or above A$10,000. The Department of Agriculture, Fisheries and Forestry Biosecurity Full Import Declaration cost-recovery charges apply to goods above A$1,000 in value and differ by mode, A$46 per air consignment and A$68 per sea consignment. Terminal handling charges, depot handling, wharfage, and potential storage if you exceed free time vary by carrier and terminal and are revised periodically. Confirm current destination charges in writing in every quote. About 98 percent of air consignments clear after initial biosecurity screening without physical inspection, but inspections when required add time and fees.
Mandatory Fees to Budget
Include the Import Processing Charge based on your consignment value band for electronic lodgement. Add the DAFF Biosecurity Full Import Declaration charges by mode, A$46 for air and A$68 for sea. GST and any duty are assessed separately and covered in step five.
Destination Charges That Swing Totals
Terminal handling, depot handling, wharfage, and potential storage if you exceed free time can materially shift your sea total. Carriers and terminals publish revisions, including changes effective 1 July 2025 in some cases, so ask your forwarder for a destination line-item estimate, not just an origin-side freight rate. Confirm the revision date and tariff version in writing so you are not surprised at invoice time.
Biosecurity Risk and Timeline
Most air consignments release quickly after screening. Physical inspections, if triggered by commodity or documentation gaps, add time and cost. Provide accurate commodity descriptions and any required treatment certificates up front to minimize holds.
Step 5: Duties and GST, What Changes at A$1,000 and by Origin
Consignments at or below A$1,000 to consumers trigger GST at point of sale, consignments above A$1,000 are assessed GST and any duty at the border with the Full Import Declaration and Import Processing Charge applicable.
For goods originating in the United States, the Australia-United States Free Trade Agreement means about 99 percent of tariff lines are duty-free into Australia when proper origin documentation accompanies the shipment, though GST still applies. Low-value goods at or below A$1,000 sold to Australian consumers incur a 10 percent GST collected at the point of sale by the overseas seller or marketplace, not at import. For business-to-business consignments at or below A$1,000, duty and GST are not collected at import. Ensure invoicing reflects correct importer details. Consignments above A$1,000 trigger GST and any applicable duty assessed at the border on a Full Import Declaration.
GST Rules by Consignment Value and Channel
Business-to-consumer shipments at or below A$1,000 in value incur 10 percent GST typically charged at checkout by the seller or marketplace. Business-to-business consignments at or below A$1,000 do not collect duty and GST at import, so ensure invoicing reflects the correct importer details for downstream tax treatment. Consignments above A$1,000 are assessed GST and any duty at the border on a Full Import Declaration, with the Import Processing Charge and DAFF Biosecurity FID charge also applicable.
Preferential Duty Relief Example
United States origin eligible goods often qualify for zero percent duty under the Australia-United States Free Trade Agreement with proper origin documentation. Model GST at 10 percent of the taxable importation value even when duty is zero, so you capture the full landed cost in your worksheet.
Step 6: Payments and Settlement, Minimize FX and Transfer Costs When Paying Australian Carriers and Brokers
Map your payment rails to your freight flows, compare per-transaction fees and FX markups for each rail, and decide whether to hold AUD balances to reduce repeated conversions.
Typical United States bank wires cost US$35 to US$50 to send internationally, plus possible incoming and intermediary bank deductions that can shave another US$10 to US$30 off the amount received. Banks embed foreign-exchange markups near 3 percent above mid-market rates, while specialist providers disclose lower variable spreads, such as 0.36 to 0.4 percent in sample comparisons. SWIFT estimates more than US$1.6 billion is spent annually investigating delayed cross-border payments, and the industry is adopting richer ISO 20022 message data to reduce friction.
Practical steps, compare FX spreads across your bank and specialist providers, pay carriers and brokers in AUD where feasible to eliminate a conversion step, batch multiple small destination charges into a single transfer where possible, and add a dedicated payments line to your landed-cost worksheet so fees and spread are visible and auditable. If your overseas customers remit in crypto and you need AUD quickly to settle carrier or broker invoices, one practical route is to sell Bitcoin through platforms like Moonpay to convert to fiat in time for payment cutoffs while keeping your records tidy for reconciliation.
Map Your Payment Rails to Your Freight Flows
List who you pay, carriers, forwarders, customs brokers, depots, and note which currency they invoice. Estimate per-transaction fees and FX markups for each rail, whether a bank wire or a specialist provider. Decide whether to hold AUD balances to reduce repeated conversions, especially if you ship to Australia regularly and can forecast your payment schedule.
Reduce Fees and FX Spreads Without Slowing Operations
Request quotes in AUD from your carriers and forwarders, then compare the total cost versus receiving a USD or EUR invoice and converting at payment time. Batch multiple small destination charges, for example depot fees and document charges, into a single transfer where possible to reduce the per-transaction hit. Track FX at mid-market in your worksheet and record the spread and explicit transfer fees separately so finance can audit and challenge the numbers.
Step 7: Insurance and Risk, Price It Into the Model
Set insured value to about 110 percent of cost plus insurance plus freight, apply a 0.3 to 0.5 percent premium rate as a planning assumption, and use lane and commodity quotes for accuracy.
Go beyond policy pricing and understand carrier liability regimes by mode and convention. For ocean, Hague-Visby or Hamburg Rules limit recovery to a small amount per package or per kilogram unless you declare higher value; for air, Montreal Convention limits apply.
These are separate from your cargo insurance. If your loss exceeds carrier liability and you did not declare value, the gap is on you unless your insurance responds, so align declarations, packing lists, and documentation with the coverage you expect to receive.
Build evidentiary readiness into your process. Photograph packing and loading, note seal numbers, keep copies of house and master bills, commercial invoices, and inspection reports, and train receiving teams to document exceptions on delivery.
When a claim arises, contemporaneous documentation accelerates resolution and reduces disputes about condition, handover points, and responsibility. In higher-risk lanes, consider pre-shipment surveys or independent inspection to strengthen your evidentiary position.
Use contractual levers intentionally. Ensure your Incoterms choice matches who controls carriage and who bears risk; negotiate limits of liability and service levels where possible with forwarders; and understand how SDR-based limits translate to your shipment value. Where a declared value clause is offered, weigh the cost against potential recovery limits and your broader insurance strategy so you do not pay twice for overlapping protection.
Harden operations to prevent losses in the first place. Specify packaging performance requirements such as drop and compression standards, choose routes and schedules that avoid extreme weather exposures, and confirm temperature-control capabilities for sensitive cargo. Add shock or tilt indicators for fragile goods and audit handling at depots. Prevention is cheaper than recovery, and a small investment in packaging and routing discipline often outperforms marginal premium reductions.
Plan financial buffers and hedges. Set deductibles and self-insured retentions you can genuinely absorb, maintain a claims reserve in your cash plan, and diversify carriers and forwarders to avoid concentration risk. For buyers with extended terms or wholesale exposure, trade credit insurance or credit limits on key customers can complement cargo cover, stabilizing cash flow if a counterparty fails while goods are in transit.
Typical cargo insurance insured value is set at about 110 percent of CIF, cost plus insurance plus freight, to cover incidental costs if you need to claim. Indicative premium rates for general cargo often run 0.3 to 0.5 percent of insured value, though route, commodity, packaging, and claims history can shift pricing.
Coverage varies by mode and policy. Review exclusions such as inherent vice or improper packing, confirm deductibles, and understand the claims process before you move. Align your Incoterms choice and who procures insurance, seller versus buyer, with your operational reality so responsibility is clear.
Some founders pursuing cross-border growth also ring-fence personal or family assets from operating-company trade liabilities.
As an advanced, jurisdiction-specific option, Cook Islands asset protection trusts are often discussed; they demand specialist legal advice to ensure compliance with home-country tax and reporting obligations and to confirm suitability for your structure and risk profile.
For a plain-English overview of how such arrangements are formed, maintained, and when they may or may not be appropriate, providers like trust services Cook Island summarize the core mechanics and considerations to raise with counsel.
How to Estimate Premium Quickly
Compute cost plus insurance plus freight by adding goods value, freight, and any other costs required by your Incoterms. Set insured value to about 110 percent of that CIF figure as a planning assumption. Apply a 0.3 to 0.5 percent premium rate for a quick estimate, then refine with lane and commodity quotes from your insurer or forwarder.
Checklist to Avoid Coverage Gaps
Confirm Incoterms and the named place so your policy matches the risk transfer point. Verify exclusions, policy limits, deductibles, and claims process requirements including documentation and timelines. Declare dangerous goods and high-value items explicitly so coverage is not voided on a technicality.
Step 7A: Dispute Resolution When Claims Turn Contentious
Most cargo claims settle smoothly when you have proper documentation and insurance. But occasionally, disputes escalate—carriers deny liability, insurers challenge valuations, or freight handlers contest injury claims arising from loading or unloading accidents at your facility or theirs.
If your business operates in regional Queensland or you’re receiving freight through Townsville port, workplace injuries during cargo handling can trigger complex compensation claims. Whether it’s your own staff injured during unloading or a contractor hurt on your premises, understanding your obligations and having access to experienced Townsville lawyers who specialize in compensation law helps you respond correctly and protect your business.
Regional expertise matters in these situations. Local lawyers understand the specific tribunal processes, industry norms, and working conditions relevant to North Queensland freight operations, and can guide you through WorkCover claims or disputes that exceed standard insurance procedures.
Step 8: Time-To-Cash and Working Capital, Put a Daily Price on Speed
Carrying cost equals cost of goods sold times your annual carrying rate divided by 365, multiplied by the extra days tied up in ocean versus air, then add expected daily gross margin from earlier availability.
Pick an annual carrying rate that reflects your cost of capital, storage, shrinkage, and obsolescence risk, 15 to 25 percent is a common planning range. Compute the daily carrying cost by dividing that rate by 365 and multiply by the additional days your inventory sits in transit or storage if you choose ocean over air. Then add the expected daily gross margin you gain from earlier availability, whether that is preventing stockouts, hitting a retail launch window, or faster cash conversion. Use end-to-end days including deconsolidation and last mile rather than port to port alone so your model reflects reality.
Simple Calculation You Can Reuse
Pick an annual carrying rate, say 18 percent, that covers cost of capital, storage, shrinkage, and risk. Compute daily carrying cost and multiply by the additional days tied up in ocean versus air. Add the expected daily gross margin from earlier availability to see the true value of time saved.
Numeric Example
Suppose your cost of goods sold is A$50,000, your carrying rate is 18 percent, and ocean adds an extra twenty days versus air. Daily carrying cost is A$50,000 times 0.18 divided by 365, about A$24.66 per day. Over twenty days that is A$493 in carrying cost. If air saves those twenty days and also unlocks A$150 per day in margin from preventing stockouts, that is A$3,000 in incremental margin to weigh against the air premium. If the air premium is A$1,500, air wins because you net A$1,500 in benefit.
Step 8A: Finance Your Logistics Infrastructure Without Draining Working Capital
Once you establish regular freight flows into Australia, you often need ground-level assets—delivery vehicles for last-mile distribution, forklifts and pallet jacks for warehouse operations, or temperature-controlled trucks if you’re moving perishables. Buying these assets outright ties up capital that could fund inventory or marketing.
Asset financing lets you acquire vehicles and equipment while preserving cash flow. Unlike unsecured business loans, vehicle and equipment finance uses the asset itself as security, which typically means lower interest rates and more flexible terms. Monthly repayments align with the asset’s productive life, and you can often claim tax deductions on interest and depreciation.
This is particularly relevant if you’re scaling from small parcel shipments to full container loads that require depot storage, material handling equipment, and dedicated delivery capacity. Compare financing options before you commit capital to hard assets, especially in the early growth phase when liquidity matters more than outright ownership.
Step 9: When Air Beats Sea
Choose air when hard launch dates, backorder burn-down, or documentation timelines favor speed and the working-capital savings or earlier revenue exceed the air premium.
High-margin, launch-critical stock where delays erode revenue disproportionately is a classic air candidate. Spare parts and service-critical components where downtime costs are steep justify the per-kilogram premium. Perishables, compliance-sensitive goods, or shipments where LCL deconsolidation adds uncertainty also tilt toward air. Confirm any dangerous-goods levies, temperature-control surcharges, and security fees in your air quote up front so you are not surprised at invoice time.
Operational Triggers for Choosing Air
Hard launch dates, retail windows, or promotional campaigns that cannot slip push you toward air. Backorder burn-down and customer churn avoidance where the cost of a lost sale or contract penalty dwarfs freight savings also favor air. Documentation or inspection timelines that favor air processing speeds can tip the decision even when headline freight rates look expensive.
Cost Signals Favoring Air
Low cubic meters but high value density mean volumetric cost is still manageable and the per-kilogram rate does not dominate total cost. Sea destination charges and storage risks that erode LCL savings tilt the comparison. Working-capital savings or earlier revenue that exceed the air premium make air the rational choice even when the per-kilogram number looks high in isolation.
Step 10: When Sea Beats Air
Choose sea when forecastable demand, inventory buffers, and non-urgent timelines let you tolerate thirty to forty days door to door and per-kilogram air rates multiplied by large chargeable weights exceed full-container-load economics.
Heavy, dense cargo where actual weight dominates and volumetric air pricing punishes you is a natural sea candidate. Stable replenishment with predictable schedules enables full-container-load economics and locks in capacity. Environmental targets and internal carbon pricing favor sea’s far lower emissions intensity, about 0.023 kilograms CO2 equivalent per tonne-kilometer versus air’s 1.13. A 40-foot full container load often beats two 20-foot boxes on total cost once destination fees are included, so model both if your volume is on the cusp.
Operational Triggers for Choosing Sea
Forecastable demand and inventory buffers that let you plan weeks ahead favor sea. Non-urgent replenishment that tolerates thirty to forty days door to door without stockout risk makes ocean the default. Cargo dimensions suited to container packing efficiency, stackable, standard pallets or cartons, reduce wasted space and improve full-container-load economics.
Cost Signals Favoring Sea
Per-kilogram air rates multiplied by large chargeable weights quickly exceed full-container-load economics, especially when your cargo is dense and volumetric pricing does not help. Destination fees that are predictable and manageable with proper planning keep sea competitive. Emissions accounting or internal carbon pricing that assigns a dollar cost per tonne of CO2 equivalent makes air uneconomic unless operational necessity overrides.
Step 11: Seasonality and Volatility, Plan Buffers and Contracts
Build earlier handover dates ahead of Chinese New Year and Golden Week, confirm equipment availability and cutoffs two to three weeks earlier than usual, and consider index-linked contracts or block-space agreements where volumes allow.
Chinese New Year and other peaks extend ocean transit and processing times because equipment is tight and factory and port labor shifts. The 2025 volatility in container indices, the World Container Index sat at about US$3,543 per 40-foot container in mid-June, underscores the need to sanity-check quotes and build buffers into planning rates. Index-linked contracts, block-space agreements, or minimum-commitment mechanisms can stabilize your cost base and guarantee capacity during peaks if your volumes support it.
Plan Around Known Peaks
Build earlier handover dates ahead of Chinese New Year and Golden Week so you are not competing for scarce equipment. Confirm equipment availability and carrier cutoffs with your forwarder two to three weeks earlier than usual, and book space as soon as volumes are firm rather than waiting until the last moment.
Stabilize Your Cost Base
Use index-linked mechanisms that tie your freight rate to a published container index for longer-term predictability. Lock capacity via block-space or minimum-commitment agreements where your volumes allow, trading some flexibility for guaranteed equipment and stable pricing during peak seasons.
Step 12: Sustainability, Factor Emissions Into the Mode Decision

Air emits 1.13 kilograms CO2 equivalent per tonne-kilometer versus sea’s 0.023 kilograms CO2 equivalent per tonne-kilometer, so if timelines allow, sea freight materially reduces emissions per tonne-kilometer.
The emissions intensity gap is large. If your delivery window tolerates the longer transit, sea reduces your carbon footprint dramatically and supports environmental, social, and governance reporting. Add a carbon line item or internal target to your mode decision so the choice is documented and defensible when stakeholders ask why you chose air despite the higher footprint.
Back-Of-Envelope Emissions Comparison
Suppose you move 0.5 tonnes over 7,000 kilometers. Air emits 0.5 times 7,000 times 1.13, about 3,955 kilograms CO2 equivalent. The same move by sea emits 0.5 times 7,000 times 0.023, about 80.5 kilograms CO2 equivalent. If your delivery window tolerates the longer transit, sea reduces your footprint by about 50x.
Practical Reporting Tips
Record mode, distance, and weight per shipment in your operations log to estimate emissions consistently across your freight portfolio. Document your rationale when you choose air, for example stockout avoidance with quantified financial impact, so stakeholders understand the trade-off and see that you evaluated lower-carbon alternatives.
Step 13: Mini Case Comparisons, Three Worked Examples
Work through three realistic scenarios so you can swap in your numbers and see how freight, Australian fees, GST or duty, payments, insurance, and working capital combine to drive the mode decision.
Case A: 0.6 CBM / 100 kg Electronics Launch (Air vs. LCL)
Assumptions, customs value A$5,000, origin East Asia, destination Sydney, insured at 110 percent of CIF, carrying rate 18 percent, AUD to USD exchange rate 0.70 for planning, importer is the payer. For air, chargeable weight is the maximum of actual 100 kilograms and volumetric 0.6 times 167, about 100.2 kilograms, so chargeable is 100 kilograms.
Apply a rate of US$6.50 per kilogram for freight of US$650. Insurance is about 0.4 percent of insured value. Australian fees are Import Processing Charge A$50 for the value band and DAFF Biosecurity FID A$46 for air. GST is 10 percent of the taxable importation value.
Payments line includes a 3 percent bank FX markup plus a US$40 wire fee. For LCL, freight is about US$120 per cubic meter times 0.6, US$72, but destination LCL and deconsolidation charges add materially, obtain a line-item quote from your forwarder. Australian fees are Import Processing Charge A$50 and DAFF Biosecurity FID A$68 for sea.
GST is 10 percent. Payments line is the same. Transit, express air one to four days, standard air eight to ten days, ocean thirty to forty days. Compare the air premium against LCL plus carrying cost for twenty to thirty extra days. If launch margin per day is at or above air cost per day saved, air wins.
Case B: 2.0 CBM / 200 kg Homewares Restock (Air Volumetric vs. LCL + AU Fees)
Assumptions, customs value A$8,000, destination Melbourne, carrying rate 20 percent, similar payment assumptions. For air, volumetric weight is 2.0 times 167, about 334 kilograms, which exceeds actual 200 kilograms, so chargeable is 334 kilograms. Apply a rate of US$5.50 per kilogram for freight of US$1,837.
Australian fees are Import Processing Charge A$50 and DAFF Biosecurity FID A$46 for air. GST is 10 percent. Insurance is about 0.4 percent. For LCL, freight is about US$100 per cubic meter times 2.0, US$200, plus destination LCL charges from your forwarder quote. Australian fees are Import Processing Charge A$50 and DAFF Biosecurity FID A$68 for sea. GST is 10 percent. Insurance is about 0.4 percent.
Working capital, ocean’s extra twenty to thirty days means you calculate daily carrying cost and add to the LCL baseline. Result, for restock without urgency, LCL usually dominates. If a retail window is tight, recompute with the breakeven method to test whether air is justified.
Case C: 18 Pallets (FCL 40-Foot) vs. Multiple Air Shipments
Assumptions, payload fits one 40-foot container, customs value A$60,000, carrying rate 18 percent. For ocean FCL, spot is about US$3,000 for a 40-foot container as a mid-range planning figure. Destination terminal handling charge and wharfage apply. Australian fees are Import Processing Charge A$152 for the value band at or above A$10,000 and DAFF Biosecurity FID A$68 for sea.
GST is 10 percent. Insurance is about 0.35 to 0.5 percent. For the air alternative, aggregated chargeable weight is 3,000 kilograms at US$5.00 per kilogram, which totals US$15,000 in freight. Australian fees are Import Processing Charge A$152 and DAFF Biosecurity FID A$46 for air. GST is 10 percent. Insurance is about 0.3 to 0.5 percent. Transit, air eight to ten days standard versus ocean thirty to forty days plus depot pickup. Decision, unless a major stockout risk exists, 40-foot full-container-load economics dominate. Compute cost per day of speed to test exceptions, but in most stable replenishment scenarios sea wins by a wide margin.
Brief Your Forwarder: The Essential Checklist
Forwarders price accurately when they get commodity and HS code, exact dimensions and weights, delivery constraints, arrival windows, Incoterms, and payment currency in a single request.
State your commodity and HS code and attach photos or a specification sheet for unusual cargo.
Declare your Incoterms choice, DAP, DDP, or DPU, and the named place so responsibility is clear. List dimensions and weight per carton and per pallet, stackability, and packaging details so the forwarder can calculate chargeable weight and cubic meters accurately. Specify your required arrival date window and any penalties for late delivery so the forwarder can recommend the right service level. Note delivery address constraints such as dock hours, appointment requirements, tail-lift needs, or residential surcharges.
State your insurance level or coverage expectation and who procures it. Specify payment currency, preferably AUD for Australian-side charges, and add a billing contact so invoices land in the right inbox without delays.
Data to Include in Every Request for Quotation
Commodity and HS code, attach photos or a specification sheet for unusual cargo. Incoterms choice, DAP, DDP, or DPU, and the named place. Dimensions and weight per carton and per pallet, stackability and packaging.
Required arrival date window and any penalties for late delivery. Delivery address constraints including dock hours, appointment, tail-lift, or residential flags. Insurance level or coverage expectation and who procures it. Payment currency, preferably AUD for Australian-side charges, and the billing contact.
Quick Tools Box: Calculators and Columns to Copy
Use 167 kilograms per cubic meter for volumetric conversions, build a standard landed-cost worksheet with freight, fees, insurance, payments, working capital, and emissions lines, and log mid-market and applied FX rates for every transfer to quantify spread.
Chargeable weight calculator, use 167 kilograms per cubic meter as the quick conversion, volumetric kilograms equals cubic meters times 167. Chargeable kilograms equals the maximum of actual kilograms and volumetric kilograms.
Landed-Cost Worksheet Columns
Goods value, freight by mode, origin charges, destination charges. Australian fees, Import Processing Charge and DAFF Biosecurity FID. Duty, GST, insurance.
Payments line showing transfer fees plus FX spread versus mid-market. Working-capital cost calculated as cost of goods sold times carrying rate divided by 365 times extra days. Emissions estimate in kilograms CO2 equivalent.
FX Impact Calculator
Transfer fees as a flat amount plus FX spread as a percentage times the converted amount equals your total payment cost. Log the mid-market rate and the applied rate for each transfer so you can quantify the spread and challenge it if needed.
Emissions Note for ESG
Air 1.13 kilograms CO2 equivalent per tonne-kilometer, sea 0.023 kilograms CO2 equivalent per tonne-kilometer. Document your mode choice and rationale when you deviate from the lower-emission sea option so stakeholders understand the trade-off.
Conclusion: Decide, Book, and Pay With Fewer Surprises
Lock your mode using cost per day of speed versus margin per day gained, book capacity early around seasonal peaks, confirm destination charges and Australian fees in writing, and decide your payment rail, currency, and reconciliation plan before goods move.
Run the breakeven calculation, air total minus sea total divided by days saved equals cost per day of speed. Compare that to the margin per day you gain from earlier delivery, whether hitting a launch window, avoiding stockouts, or faster cash conversion.
Choose the mode that preserves more margin. Lock space with your carrier or forwarder as soon as volumes are firm, especially ahead of Chinese New Year, Golden Week, or other peaks when equipment is tight.
Align on Incoterms and pre-file clearance documents with your customs broker so paperwork does not delay release. Select your payment rail and currency, preferably AUD for Australian-side charges, and set a reconciliation cadence that finance can audit so you are not chasing missing funds or unexplained deductions weeks after goods arrive.
This framework gives you a repeatable, numbers-first way to choose air or sea, price every line item that affects landed cost, and avoid payment friction that erodes freight savings.
Your Next Three Moves
Run the breakeven calculation using air total minus sea total divided by days saved, including Australian fees, payments and FX, insurance, and working capital in both totals. Lock space with your carrier, align on Incoterms, and pre-file clearance documents with your broker so paperwork is ready when goods arrive. Select your payment rail and currency, confirm FX spread and transfer fees in writing, and set a reconciliation cadence that finance can audit so you catch discrepancies early and improve the process for the next shipment.

How On-Demand Delivery Can Double Your Sales

The Vital Role Of General Dentistry In Lifelong Oral Health

How to Choose the Right Mousepad desk mats for Your Desk Layout

How Rocket Canopy Windproof Walls Protect Your Booth in Harsh Weather

Why Preventive Dental Planning Matters For Households

Why Parasite Prevention Is A Central Focus In Veterinary Clinics

Common Mistakes People Make When Buying Paneer Cheese

7 Smart Reasons Designer Radiators Are Becoming a Must-Have in Modern UK Homes

Heavy Towing Near Me: Fast, Safe, and Reliable Solutions for Heavy-Duty Vehicle Recovery

From Messaging App to Digital Ecosystem: The Evolution of Telegram

Who Is Jennifer Rauchet?: All You Need To Know About Pete Hegseth’s Wife

Who Is Mindy Jennings?: All You Need To Know About Ken Jennings Wife

Who Is Enrica Cenzatti?: The Untold Story of Andrea Bocelli’s Ex-Wife

Who Is Klarissa Munz: The Untold Story of Freddie Highmore’s Wife

Who Is Mallory Plotnik?: The Untold Story of Phil Wickham’s Wife

Meet Christina Erika Carandini Lee?: All You Need To Know Christopher Lee’s Daughter

Who Is Allison Butler?: The Life and Influence of Kirk Herbstreit Wife

Who Is Terrance Michael Murphy?: Everything about Audie Murphy’s Son

Alec Bohm Wife: Everything You Need to Know About Jacque Darby

Who Is Jessica Marie Blosil?: Everything About Marie Osmond’s Daughter
How On-Demand Delivery Can Double Your Sales
The Vital Role Of General Dentistry In Lifelong Oral Health
How to Choose the Right Mousepad desk mats for Your Desk Layout
How Rocket Canopy Windproof Walls Protect Your Booth in Harsh Weather
Why Preventive Dental Planning Matters For Households
Why Parasite Prevention Is A Central Focus In Veterinary Clinics
Common Mistakes People Make When Buying Paneer Cheese
7 Smart Reasons Designer Radiators Are Becoming a Must-Have in Modern UK Homes
Heavy Towing Near Me: Fast, Safe, and Reliable Solutions for Heavy-Duty Vehicle Recovery
From Messaging App to Digital Ecosystem: The Evolution of Telegram
-
 Celebrity1 year ago
Who Is Jennifer Rauchet?: All You Need To Know About Pete Hegseth’s Wife
-
 Celebrity1 year ago
Who Is Mindy Jennings?: All You Need To Know About Ken Jennings Wife
-
 Celebrity1 year ago
Who Is Enrica Cenzatti?: The Untold Story of Andrea Bocelli’s Ex-Wife
-
 Celebrity2 years ago
Who Is Klarissa Munz: The Untold Story of Freddie Highmore’s Wife